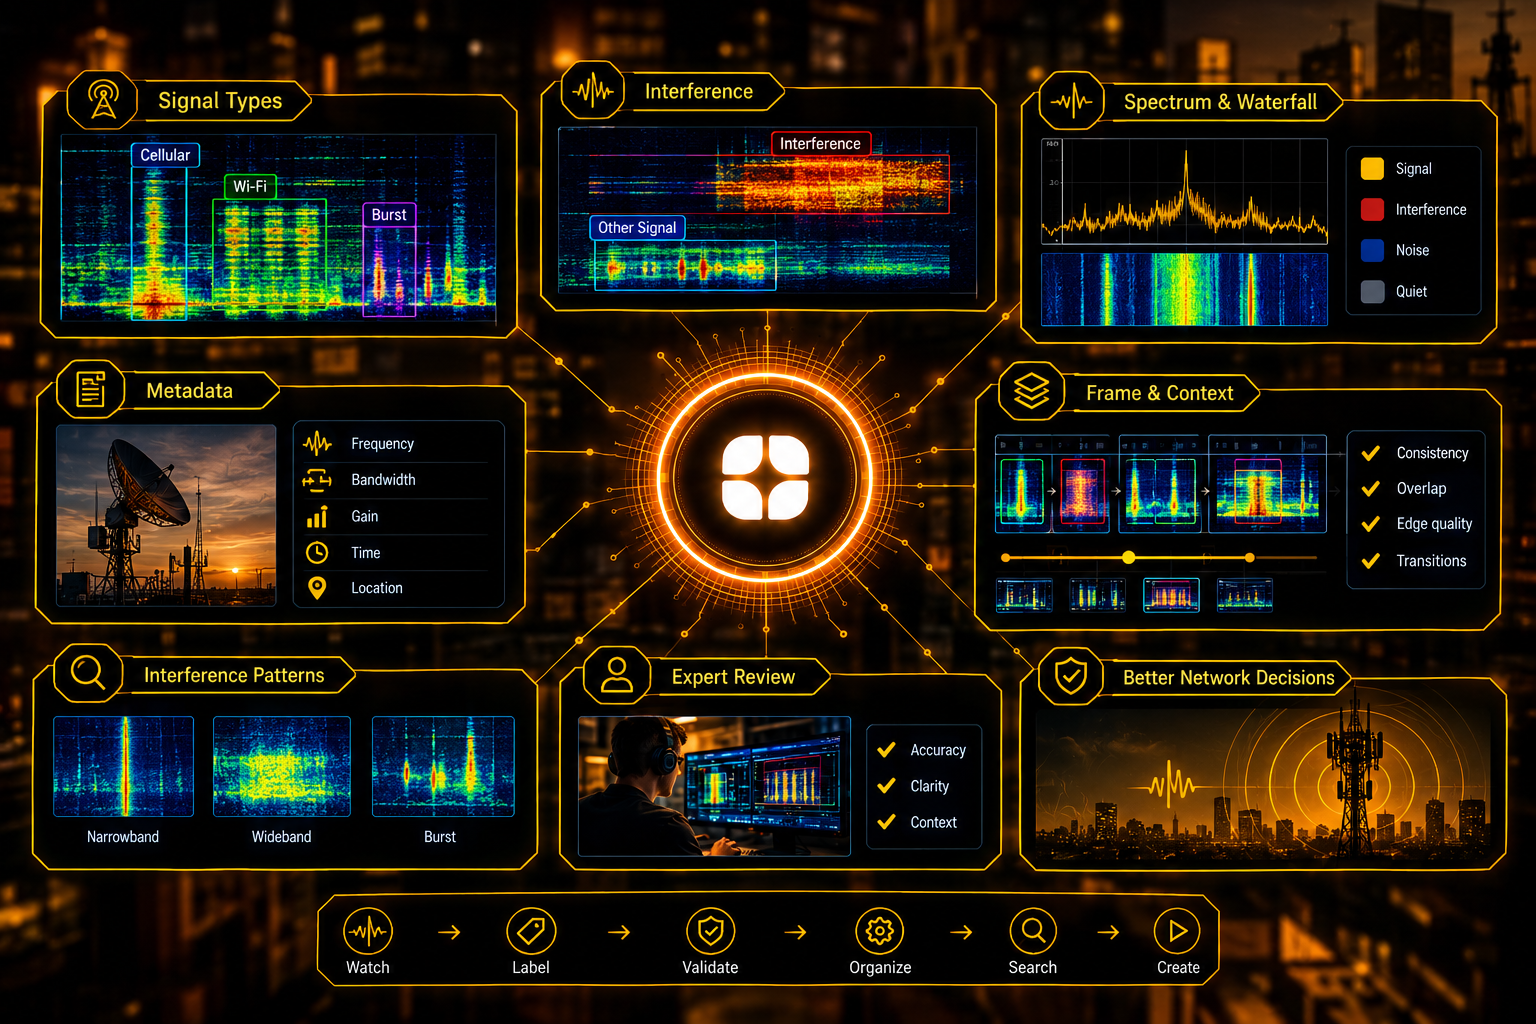
Every wireless network shares the air with other signals. Cellular networks, Wi-Fi, and many other systems all transmit through the same space, and they sometimes disturb one another. When interference appears, call quality drops, data slows, and engineers have to find the cause.
Spotting it by hand means staring at charts of radio activity for hours. AI can watch continuously and flag problems, but it learns from labeled examples. Radio signal labeling is the work of marking what each signal is and where interference appears. This post explains what that data looks like, why it is difficult to label, and why radio expertise matters.
Radio engineers rarely look at raw samples. They look at pictures made from them.
A spectrum plot shows how much power sits at each frequency at one moment. A spectrogram, also called a waterfall, adds time. Frequency runs along one side, time along the other, and color shows how strong the signal is. A steady transmission appears as a long line. A short burst appears as a small block.
Most labeling work happens on these time-frequency images. Annotators draw boxes around signals, assign a type to each, and mark anything that looks like interference.
A typical project covers several kinds of labels:
More advanced projects add details such as bandwidth or the way the signal is encoded. These need specialist knowledge, and a project should decide early how deep to go.
A spectrogram is not an objective photograph. How it looks depends on display settings: the color scale, the range of power shown, and how finely frequency and time are divided. The same signal can look bright and sharp in one image and faint and smeared in another.
Annotators who do not know this can mislabel what they see. A weak signal may fade into the background on one setting and stand out on another. Guidelines should record the settings used for each image, and annotators should be trained to read them.
This is one reason radio labeling does not suit generalists. The picture is only meaningful to someone who knows how it was made.
Real radio activity is crowded. Signals overlap in time and frequency, weak signals sit close to the noise, and bursts appear and disappear in moments.
Interference labeling therefore needs clear rules for several questions:
Without written answers, two annotators will draw different boxes on the same image. That inconsistency passes straight into the model, which then learns fuzzy edges.
This is the hardest question in the field. A strange signal in a band is not automatically interference. It might be a legitimate transmission that the network is expected to carry, or it might be something that should not be there.
The answer depends on context. Annotators need to know what belongs in that band at that site: the frequency plan, the expected users, and the equipment in range. Without that reference, they will either flag everything unfamiliar or ignore real problems.
Projects should supply this context alongside the data. They should also include an "unknown" label, because some signals cannot be classified from the image alone. Guessing teaches the model false certainty.
Interference comes from different sources, and each tends to leave a different pattern:
A steady narrow line, a wide raised floor, and a series of short pulses each point to a different cause. Labels that capture the pattern, not just "interference," give the model something useful to learn. Each cause also needs a different fix, so the label has to help the engineer decide where to look.
Some interference types are rare. A dataset needs enough examples of each to teach recognition, and annotators need examples to learn the less common patterns.
Radio receivers differ. They have different sensitivity, noise levels, and ways of recording. The same event can look different when captured on different equipment.
For this reason, every recording needs metadata: center frequency, bandwidth, gain, time, and location. Labels made without this information are hard to trust and hard to reuse. A dataset built from many receivers should record which one produced each image, so the model can learn that differences in appearance do not always mean differences in the signal.
Radio engineers read spectrograms the way a radiologist reads a scan. They know what a healthy signal looks like, can recognize the patterns of different interference sources, and understand how display settings change the picture. They also know what should and should not be in a band.
They write the rules that keep a large team consistent: how tightly to draw boxes, how to treat overlap, and what to do with unknown signals. This matches Globik's approach of using verified domain experts for work that depends on judgment. For telecom AI training data, that expertise is what separates useful labels from confident mistakes.
Before a radio labeling project starts, a team can settle five things:
Radio AI works when labels capture signals accurately, handle overlap and weak signals with clear rules, and rely on context to separate interference from legitimate traffic. If you are building AI for wireless networks, you can talk to our team about your data. Strong interference labeling starts with people who can read the spectrum.
It is the marking of signals and interference on spectrum images so AI can recognize them automatically.
It is an image that shows signal strength across frequency and time, and most radio labeling is done on it.
Signals overlap, weak ones sit near the noise, and annotators need band context to tell interference from legitimate traffic.
Receiver settings change how a signal looks, so labels need frequency, gain, and time to be trustworthy.
They read spectrograms correctly, recognize interference patterns, and know what belongs in each band.